


Understanding the “tug-o-war” between buyers and sellers on exchanges is necessary for identifying market trends and predicting future price movements. Onchain data reveals a struggle for control between buyers and sellers, with buyers gaining the upper hand.
This analysis highlights the importance of monitoring onchain data and market structure to make informed investment decisions. By recognizing the strength of both buyers and sellers, traders can anticipate potential price movements and adjust their strategies accordingly. By analyzing the balance of power between bulls and bears, traders and investors can gain valuable insights into the direction of the market, identifying the strength of each side and how they interact to help make informed decisions about their investments.
This post analyzes the technical aspects of BTC price action, using onchain analytics data.
Read Also: Bitcoin price slides to $53k: Why, and Where Next?
BTC price is poised to retest $72,000.
BTC price is poised to retest $72,000 as it prepares for a $7 billion liquidation showdown, following a brief cooling-off period that saw support hold steady, with prices rebounding by 1% to target $67,000 on July 24. This price movement seemed like a “tug-o-war” between buyers and sellers as both are in constant struggle for control of the market price.
As buyers and sellers interact on exchanges, price is determined by the balance between their respective forces. On one hand, buyers, also known as bulls, are driven by their belief that the price of a cryptocurrency will rise in the future. They seek to purchase coins in anticipation of selling them at a higher price later, thereby driving prices up.
On the other hand, sellers, also known as bears, are motivated by their expectation that the price will fall. They aim to sell their coins before the price drops, which puts downward pressure on the market. Understanding the dynamic between buyers and sellers is crucial for predicting price movements in the crypto market.
Read also: What do ‘bull’ and ‘bear’ markets mean and how do you identify them?
Technical Analysis of BTC Price Action
BTC price action is setting up for a potential retest of $72,000, with a short-term rebound on July 24 targeting $67,000. This move follows a cooling-off period that saw BTC price support stay firmly in place, with key support levels at $65,000 and the short-term holder realized price at $65,110 remaining intact. The latter level, which represents the aggregate cost basis of BTC speculators, was recently reclaimed as support after a brief absence, suggesting a bullish market structure.
The longer-term picture shows BTC consolidating at the previous cycle’s high for 141 days, the longest time it has taken to fully break through a previous all-time high. This consolidation phase has seen BTC’s trading corridor narrow, with attention turning to the potential for a breakout above $72,000. Onchain data suggests that a significant amount of short liquidations, totaling around $7 billion, could be triggered if BTC breaks above this level, potentially fueling a rapid price increase.
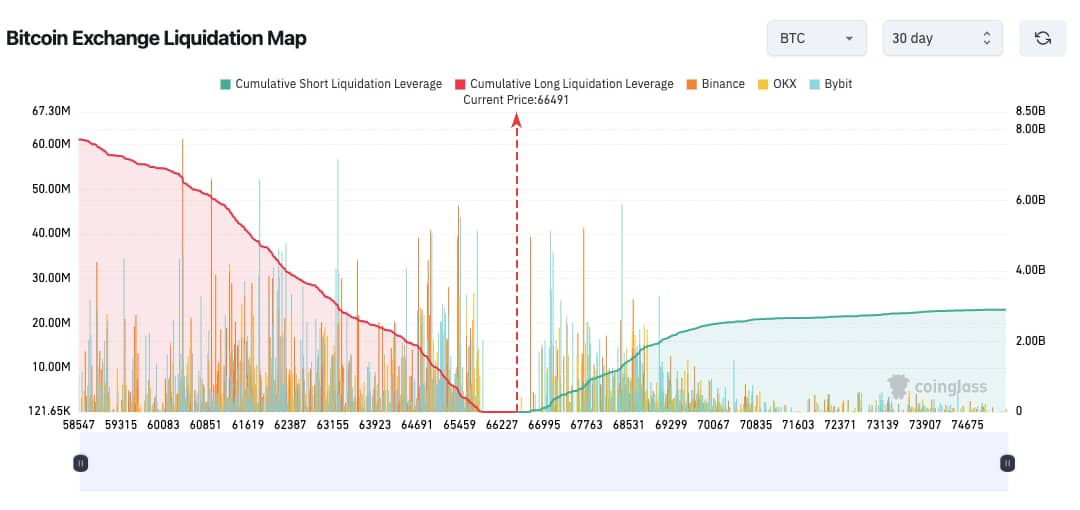
Bitcoin exchange liquidation map (screenshot). Source: CoinGlass
Despite some bearish factors, such as the potential impact of US spot Ether ETFs siphoning capital out of BTC, onchain analyst Willy Woo believes that bullish factors overpower bearish factors. A break above $73,000 could trigger a short squeeze to $77,000, with no significant resistance levels above that to prevent price discovery. Overall, BTC price action suggests a bullish outlook, with a potential retest of $72,000 and a longer-term target of $77,000.
Read also: How Mt. Gox’s Bitcoin Transfer Could Impact the Cryptocurrency Market
Identifying the “Tug-o-War” in the Data
Onchain data reveals a “tug-o-war” between buyers and sellers in the BTC market, with both sides engaging in a struggle for control.
On one hand, the successful reclamation of the short-term holder realized price at $65,110 as support suggests that buyers are gaining strength. Also, the consolidation phase at the previous cycle’s high for 141 days indicates a buildup of buying pressure.
On the other hand, the potential impact of US spot Ether ETFs siphoning capital out of BTC and the brief absence of the $65,110 level as support suggest that sellers are still present and active.
However, onchain data suggests that buyers are gaining the upper hand. The narrowing of BTC’s trading corridor and the potential for a breakout above $72,000 indicates a buildup of buying momentum. Furthermore, the significant amount of short liquidations totaling around $7 billion that could be triggered if BTC breaks above $72,000 suggests that sellers are vulnerable to a short squeeze.
Onchain analyst Willy Woo believes that bullish factors overpower bearish factors, and a break above $73,000 could trigger a rapid price increase to $77,000. Obviously, onchain data currently indicates that buyers are winning the “tug-o-war”. A bullish outlook is likely.
Read Also: Oversold Territory: Is bitcoin due for a bounce or further decline?
Solomon Victor is a Technical Analyst who is also knowledgeable about various aspects of blockchain and cryptocurrency.
Discover more from Crypto Asset Buyer
Subscribe to get the latest posts sent to your email.