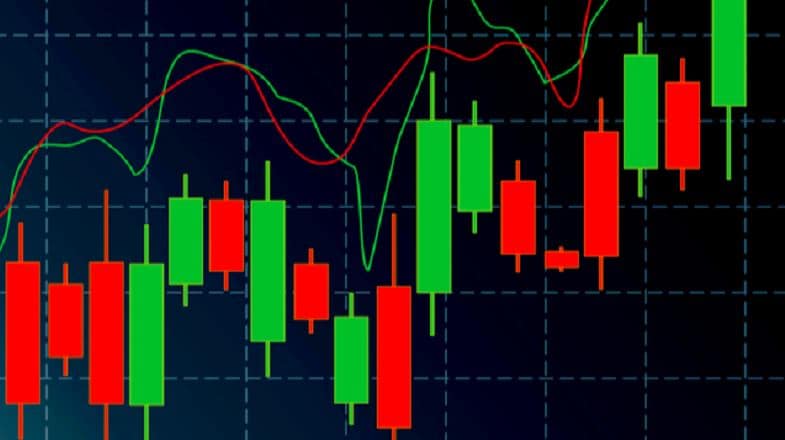
Are you wondering what cryptocurrency to buy, and when? When you research crypto assets, you may run into a special type of price graph called a candlestick chart. So it’s good to take a little time to learn how these work.
What are Candlestick Patterns?
A candlestick is a visual summary of whether a market’s prices went up or down and how much. The timeframe represented in a candlestick can vary widely, and the crypto market never sleeps; it’s awake 24/7. The opening and closing prices on a candlestick represent the points where the price begins and ends, on a particular timeframe.
Common candlestick timeframes include minutes, hours, days, and weeks, each providing unique insights into market movements.
Imagine looking at a chart of a cryptocurrency’s price over time, where each day or time period is represented by a “candle.”
You might also like: Crypto Market Crash amidst Fear, Uncertainty, and Doubt (FUD)
Traders have noticed that when certain candlestick patterns appear, they tend to be followed by specific price movements. These patterns can suggest whether it’s a good time to buy, sell, or hold a cryptocurrency. Traders use these historical patterns to make informed decisions about their crypto investments, hoping to profit from the expected price trends. So, in essence, candlestick patterns are a visual tool that helps traders understand and anticipate market dynamics in the cryptocurrency world.
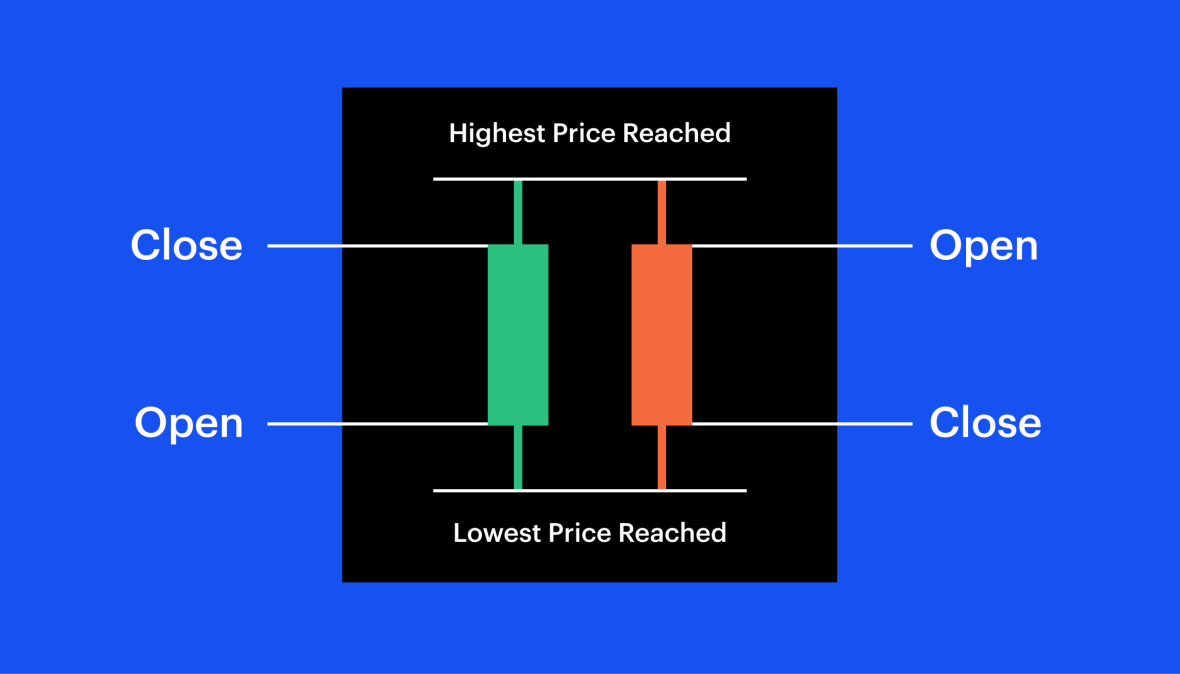
Green candles show prices going up, so the open is at the bottom of the body and the close is at the top. Red candles show prices declining, so the open is at the top of the body and the close is at the bottom.
What do candlesticks tell us?
Candlesticks can reveal much more than just price movement over time. Experienced traders look for patterns in order to gauge market sentiment and to make predictions about where the market might be headed next. Here are some of the kinds of things they’re looking for:
Long wick at the bottom
A long wick on the bottom of a candle, for instance, might mean that traders are buying into an asset as prices fall, which may be a good indicator that the asset is on its way up.
Long Wick at the Top
A long wick at the top of a candle, however, could suggest that traders are looking to take profits—signaling a large potential sell-off in the near future.
Short Wick or no Visible Wick
If the body occupies almost all of the candle, with very short wicks (or no visible wicks) on either side, that might indicate a strongly bullish sentiment (on a green candle) or strongly bearish sentiment (on a red candle).
Technical Analysis
Understanding what candlesticks might mean in the context of a particular asset or within certain market conditions is one element of a trading strategy called technical analysis—by which investors attempt to use past price movements to identify trends and potential future opportunities.
Read also: What are the top 5 technical analysis indicators to know?
Understanding Bullish and Bearish Candlestick Patterns
Candlestick patterns are visual representations of price movements on a chart, and they play a crucial role in helping traders analyze and predict market behavior.
Traders operating in really short time frames sometimes focus on just one candle. Familiarizing yourself with these “one-candle signals” can be a helpful exercise as a beginner. However, experienced traders usually prefer to look at the bigger picture of the charts.
Whether you’re a beginner or an experienced trader, the charts give graphical clues that provide insights into the psychology of market participants.
- Candlestick Components:
Body: The rectangular area of the candlestick represents the price range between the opening and closing prices during a specific time period.
Wicks (or Shadows): These are the lines extending above and below the body, indicating the highest and lowest prices reached during that time frame.
- Bullish and Bearish Candlesticks:
A bullish candlestick typically has a green or white body, with the open at the bottom and the close at the top. It suggests that prices rose during the time period.
A bearish candlestick is usually red or black, with the open at the top and the close at the bottom, indicating a price decrease during that time.
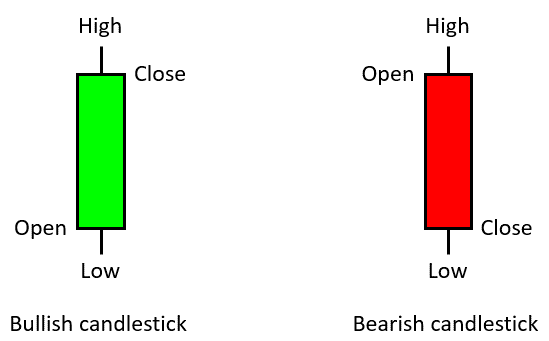
Bullish and Bearish Candlesticks
- Patterns:
Candlestick patterns can be categorized into various groups, including reversal patterns, continuation patterns, and indecision patterns.
Reversal patterns indicate potential trend reversals. For example, a “Hammer” is a bullish reversal pattern with a small body and a long lower wick.
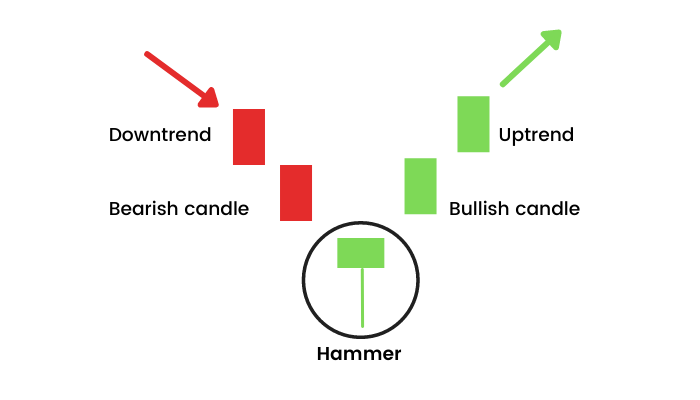
Hammer candlestick pattern
Continuation patterns suggest that the existing trend is likely to continue. A “Bullish Flag” is an example of a continuation pattern.
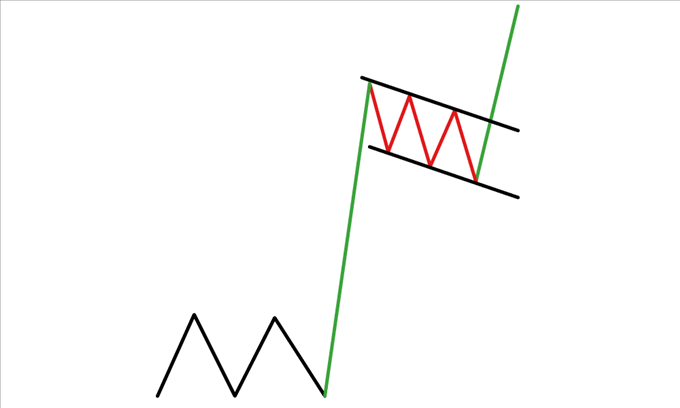
Bullish flag pattern
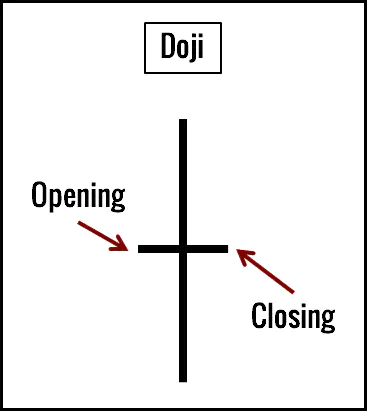
Indecision patterns, like the “Doji”, signal market uncertainty and can precede trend reversals.
Analyzing Candlestick Patterns
To effectively read candlestick patterns, you should consider the following:
- Pattern Recognition:
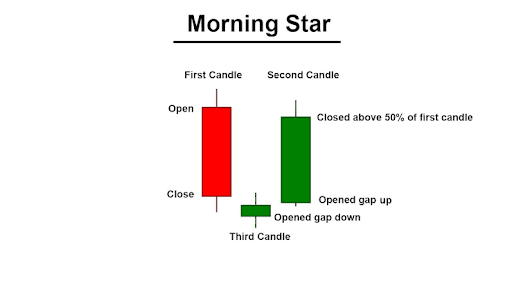
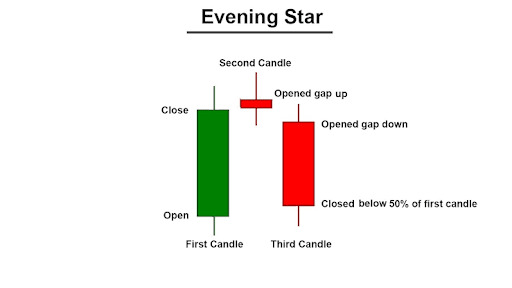
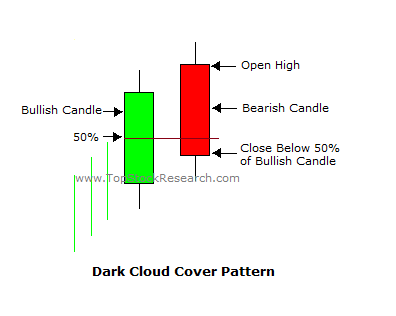
- Familiarize yourself with common candlestick patterns like “Engulfing,” “Morning Star,” “Evening Star,” and “Dark Cloud Cover.” Recognizing these patterns at a glance is crucial.
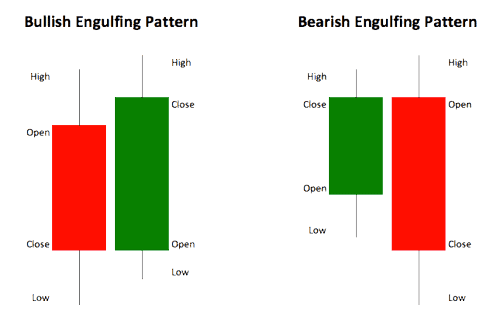
Bullish and Bearish Engulfing Patterns
- Familiarize yourself with common candlestick patterns like “Engulfing,” “Morning Star,” “Evening Star,” and “Dark Cloud Cover.” Recognizing these patterns at a glance is crucial.
Bullish and Bearish Engulfing Patterns
Morning Star Pattern
Evening Star Pattern
Dark Cloud Cover Pattern
- Timeframes:
- Candlestick patterns can vary in significance depending on the timeframe you are analyzing. Shorter timeframes, like 5-minute candles, are often used for day trading, while longer timeframes, like daily or weekly candles, are used for long-term analysis.
- Confirmation:
- It’s essential to use other technical analysis tools, such as support and resistance levels, moving averages, and volume indicators, to confirm the signals provided by candlestick patterns.
- Combining Patterns:
- Traders often combine multiple candlestick patterns and other indicators to strengthen their trading decisions. For example, a bullish candlestick pattern in confluence with strong volume and a breakout from a resistance level can be a potent signal.
- Market Context:
- Always consider the broader market context. Candlestick patterns are most effective when used in conjunction with other market factors, such as news events, market sentiment, and overall trends.
- Risk Management:
- While candlestick patterns can provide valuable insights, they are not foolproof. Implement proper risk management strategies, like setting stop-loss orders, to protect your investments.
- Continuous Learning:
- The world of cryptocurrency trading is dynamic. Stay updated with new patterns and market conditions, and continuously improve your skills.
Read more: How do I manage investment risks in the crypto market?
Discover more from CAB
Subscribe to get the latest posts sent to your email.